Gutters · Territory X-Ray
The linear feet of gutter hiding in every home.
Here's what you get: your neighborhoods ranked by how much gutter and downspout work is actually on the ground, estimated per home from the building footprint. Then a mail-ready list of those homes, addresses included. You knock with a number, not a guess.
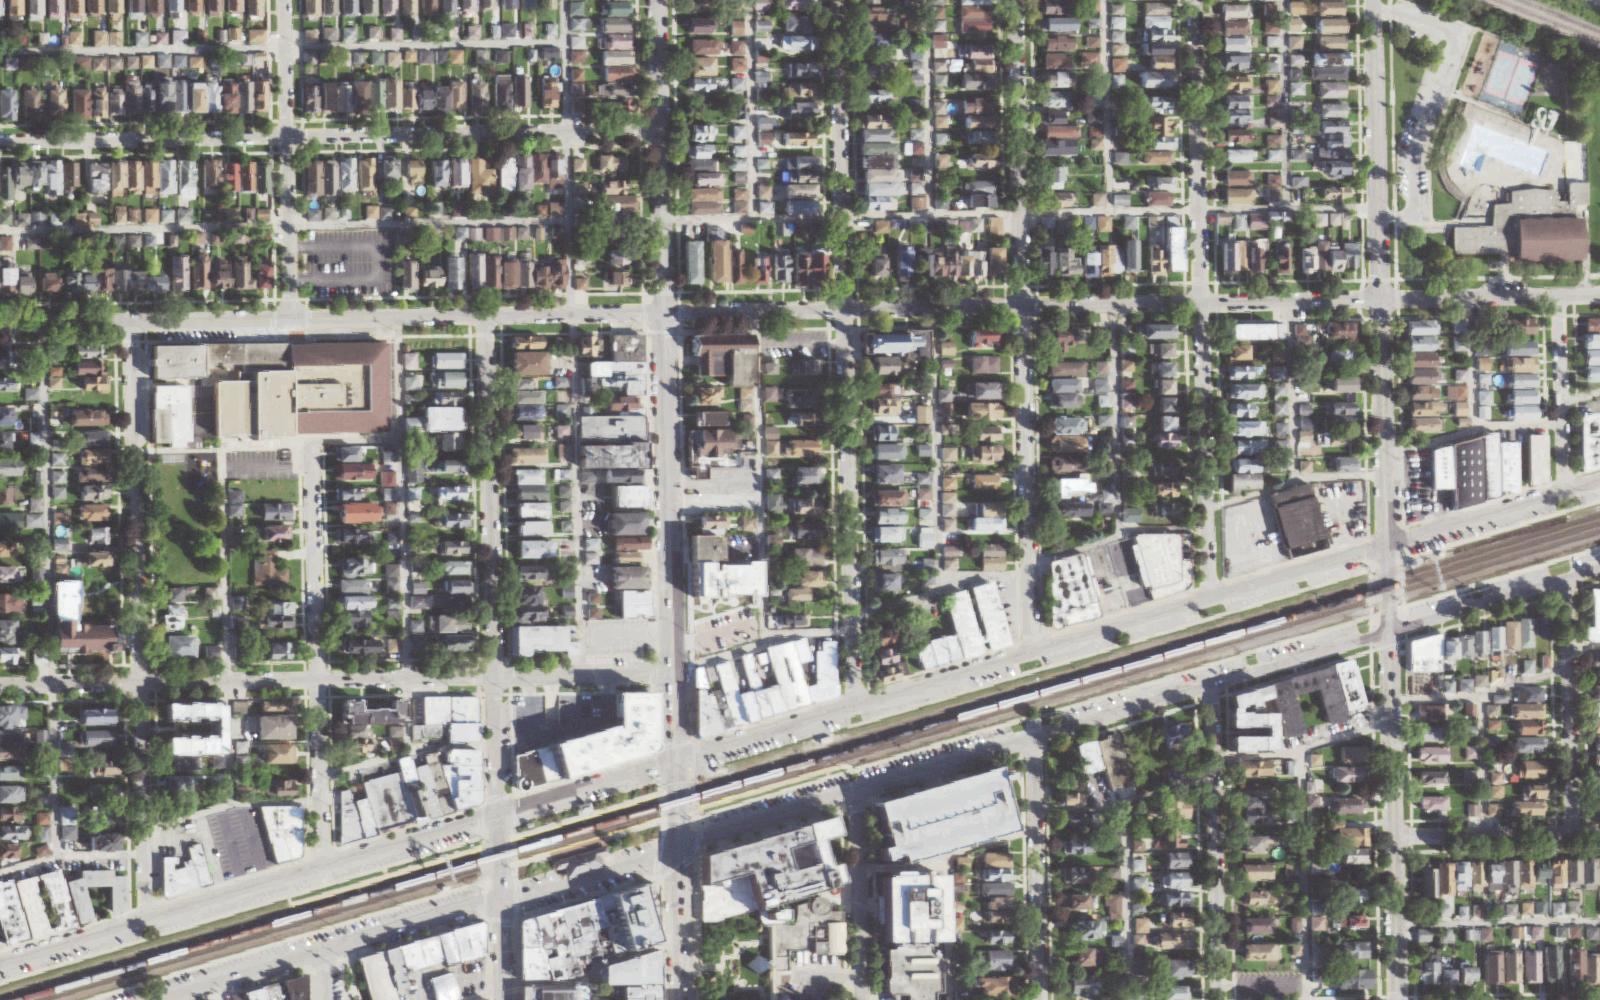 Gutters X-Ray · Berwyn, IL
Your service area, rooflines and all.Real aerial · sample
Gutters X-Ray · Berwyn, IL
Your service area, rooflines and all.Real aerial · sample
The moat
Quote the linear feet before you knock.
Most gutter mailers go to a ZIP code. Ours go to a perimeter, calculated per home.
Linear feet, calculated per home
We extract every building footprint from the county GIS and calculate its perimeter, which is your job's actual linear feet before any visit. Neighborhoods cluster by perimeter density.
Single-story vs two-story economics
Story count from CAMA. Two-story homes double the install cost, but also double the ticket. We surface the mix so the crew gets sent to the work it can actually run.
Where guard upsells live
Canopy near a home's perimeter is the gutter-guard upsell. We flag the homes with dense canopy nearby, and the neighborhoods with the most of them.
The X-Ray
Ranked by linear feet you can actually sell.
Neighborhoods cluster by perimeter density per home and story-count mix. You see the homes worth running a route through and the homes worth running a single-truck day on.
- Cluster-level rank with score 0–100
- Median linear feet per home
- Story-count mix (1 / 2 / 3+)
- Tree-line proximity (gutter-guard upsell share)
- Owner-occupant % and absentee split
The Campaign Map
A linear-feet quote per home. Truck-roll-ready.
Every home in the campaign carries its perimeter estimate and story count, so the door knock and the mailer carry a real number. Suppression keeps recent gutter permits off the list.
- Per-home perimeter estimate (linear feet)
- Story count flag (1, 2, 3+)
- Canopy / tree-line flag for guard upsell
- Owner-occupant vs absentee
- Per-home tracking ID
What goes in
Every signal that drives the score.
Linear feet from GIS
Per-home perimeter from the county GIS footprint. Cluster medians tell you where the routes are dense.
Lift cost driver
From CAMA. Drives the crew's day rate and the ticket; we split the mix per neighborhood.
Hipped vs gabled
Plane-fit complexity from LiDAR for the homes where it's available. Complex roofs = more linear feet.
Guard upsell flag
Public canopy raster near the perimeter: the guard upsell lane.
Owner vs investor
Owner-occupants get the warranty + guard pitch; absentees get the route maintenance pitch.
Recent gutter / soffit work
Indexed permits remove homes whose gutters were just done.
ROI math, honest
How a Gutters Territory X-Ray pays for itself.
Worked off a 1,500-home first-campaign cell at typical gutter economics. Your costs and close rate slot in here.
Numbers are illustrative. The X-Ray pays for itself in well under one sold installation in typical service areas.
Run roofing or siding too?
One mail drop. Three offers.
The Cross-Trade Briefing names the neighborhood worth running gutters + roofing + siding as a layered campaign. Same mailer, three angles, one truck-roll day.
Guardrails
What we say. What we don't.
Estimate per-home linear feet from public-record footprint and CAMA.
Suppress homes whose gutter / soffit permit data says the work was just done.
Tag the canopy + guard upsell lane separately.
Claim a specific gutter is failing or needs replacement. Estimates are for contractor review.
Sell homeowner contact lists. The Campaign Map ships only to the contractor.
Promise a job count or guard close rate.
FAQ
The questions gutter owners ask first.
How accurate is the per-home linear feet estimate?
The perimeter math is exact; the estimate's accuracy depends on the county footprint. In Cook the footprint matches the building outline closely. Outside Cook, accuracy varies, so we tag confidence and the X-Ray slots the low-confidence rows in a "site-visit-first" lane.
Do you measure guard footage?
We flag the canopy upsell at the neighborhood and per-home level. The actual guard footage is a site-visit number.
What about new construction?
The CAMA year-built lets you target the neighborhoods past their original gutter's warranty window. We can split that lane out if you want.
Can I get the route-density map without the campaign list?
Yes. The X-Ray itself returns the ranked neighborhoods, perimeter mix, and story mix. The Campaign Map is the next step.
What does a Gutters X-Ray cost?
$1,500–$2,500 for the service-area scan, ranked neighborhoods, and first campaign map.
Your cockpit
Sign in to your live Gutters X-Ray.
Per-home linear feet, story count, canopy upsell flag, and the deployable route, live in your browser. Quote before the truck rolls.
- Median linear feet per neighborhood
- Story-count mix (1 / 2 / 3+)
- Canopy / tree-line upsell share
- Per-home perimeter on the deployable list
- Permit suppression of recent gutter work
Run the Gutters X-Ray on your service area.
Give us your county and the towns you work. We'll come back with the ranked neighborhoods, the median linear feet per home, and the first campaign map.
Request a Gutters X-Ray